Navigating in CoreTRM
CoreTRM is an online based CTRM end to end system. Understanding how to navigate CoreTRM will improve the user experience.
Main Menu
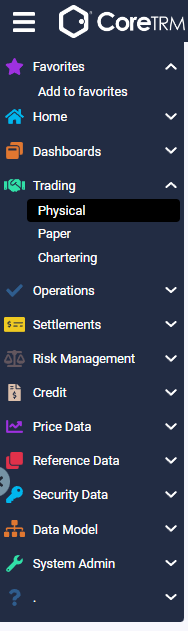
The initial configuration of CoreTRM is separated into different functional areas or views. The views can be accessed by clicking on the hamburger menu on top left. The main views are : Dashboard, Trading, Operations, Settlements, Risk Management, Credit, Price Data, Reference Data, Security Data, Data Model and System Admin.
Each view consists of sub tabs. For example, the Trading view consists of Physical, Paper and Chartering. A single click on the tab name will access that particular tab.
Dashboard: Is a view where you can request to customize the important reports that you need to view.
Trading:Is a view where contracts are entered.
Operations: Is a view where operations can update the operation events of transactions.
Settlements: Is a view where finance can create settlements and invoices for physical, paper and fees.
Risk Management: Is a view where risk can view the different risk reports and manage daily valuations.
Credit: Is a view where you can monitor credit exposure of your counterparties.
Price Data: Is a view where you can create and update your price curves.
Reference Data: Is a view where you can create and update your reference data such as commodities, locations, containers, etc.
Security Data: Is a view where you can manage user, user access and approval rules.
Data Model: Is a view where you can manage the data structure and views of the client instance.
System Admin: Is a view for system administrators.
Tabs and Views
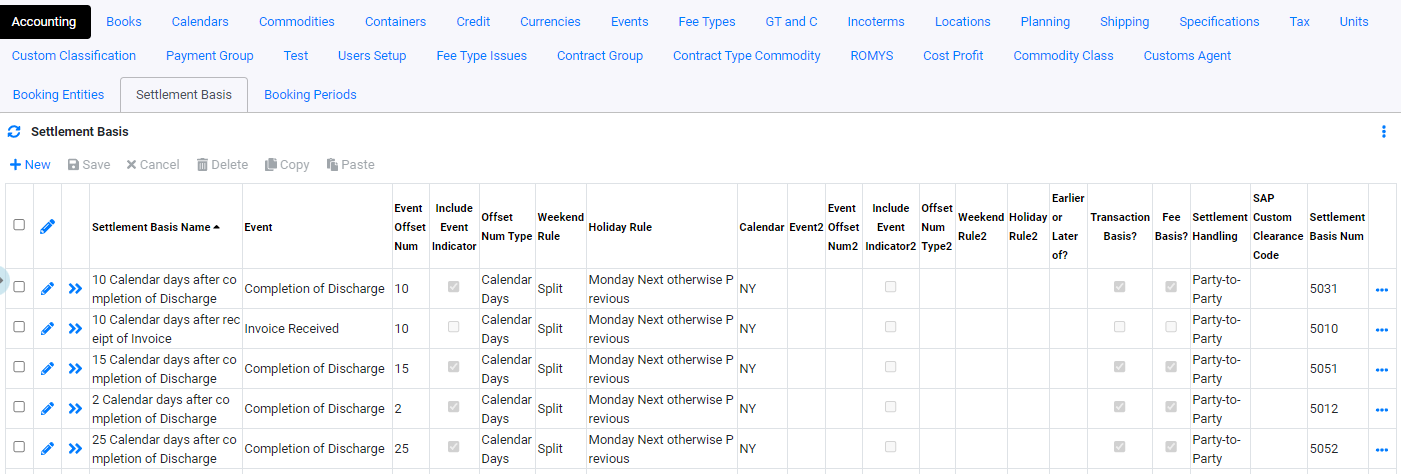
Once you are into a tab, the display may be further divided into different tabs and panels. Each tab will provide access to specific panels where you can view, update or delete data.
For example, in the Reference Data view, you will see a list of tabs on the top. Each tab give you access to different type of reference data that you can update. There are tabs such as Books, Calendars, Commodities, Containter, etc.
In the tab, you will see one of many different panels of data. Each panel will display data related to the tab name. For Example in the Commodities tab, you will see panels that allow you to update setup and information of Commodities.
View Filters

When first using a panel the data that is displayed will depend on the default filter settings. In order to display more specific data, you can use the panel filters that appear on top of the panel. Each filter allows you to narrow down the search of data from that particular panel. The type of filters are search box which you can type free text,
Search box: In a search box you can enter any free text to be searched in that item.
Dropdown/Picklist: In a dropdown/picklist you can select the available options in the dropdown/picklist.
Date box: In a date search box you can select the date or date range for that item.
Panel Function

Depending on the nature of the panel, many of them come with a set of standard functions.
 : Allows you to insert a new row in the grid.
 : Allows you to save the information entered in a row.
 : Allows you to cancel the current action.
 : Allows you to delete row(s). A row must be selected to use this function.
 : Allows you to copy a row of information for pasting. A row must be selected to use this function.
 : Allows you to paste the previously copied row(s) of data into a new row. "Copy" function must be used first before this function can be used.
 button, on top left of a grid, allows you to refresh the data display on the grid.

Some panels come with additional specific functions which users can use. For example, in thr Contract panel in Trading, there is a set of buttons which allows you to perform approvals for contracts.
More Panel Functions
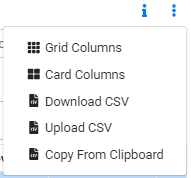
Many of the panels have some additional functions. In order to access these functions, click on  .
.
 : Allows you to add a new column/item into the grid. It also allows you to reposition the column/item order. In order to reposition the column/item order, drag a column/item and move up or down.
*In the list of available columns/items to add, there are items that are labeled as "Advanced Item". Please contact CoreTRM Support before adding those columns.*
 : Allows you to add new item into the grid. It also allows you to reposition the column/item order. In order to reposition the column/item order, drag a column/item and move up or down.
*In the list of available columns/items to add, there are items that are labeled "Advanced Item". Please contact CoreTRM Support before adding those columns.*
 : Allows you to download the current display data in the grid into CSV format.
 : Allows you to upload data to the current display grid using the CSV file. The columns in the CSV must match the column display on the grid.
 : Allows you to paste rows of data that you have already copied to the Clipboard, perhaps using Excel.
Row Functions
There are also standard functions on the row of the grid.
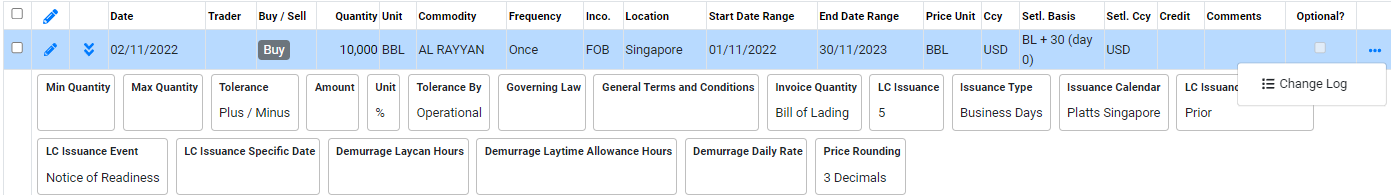
Click on  button, then the
  button, this will display the change log of this particular row of data.
Click on ![]() button to display any additional data for the row.
button to display any additional data for the row.
For some columns the data will be display as a hyperlink. For Example,  . Clicking on the hyperlink will redirect you to that item reference page. If you click on
  button, this will redirect you to that item reference page by opening a new browser tab.
Using Favorites
You are able to add specific views to your favorites in CoreTRM. Favorites will appear at the top of the left menu.
To add a view as a favorite.
- Navigate to the view that you wish to add to the favorite. For example, it can be Physical or Paper view.
- Click on the left menu and from Favorites, click "Add to favorite".
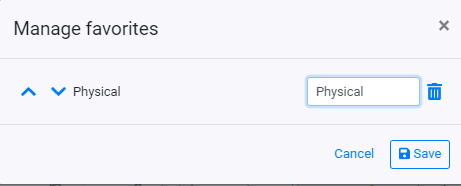
- Once you have added the view to favorites, go to Favorites -> Manage favorites.
- From the Manage favorites pop up you can optionally enter a Menu text... for the favorite and click save.
- Next, you will now be able to see the favorite on the top menu bar as well as the left menu.
- You can also edit or delete the favorite by going back to Manage favorites.


Browse More
- Overview
- Introduction and Navigation
- Quick Links
- Trading : Physical Deal Entry
- Trading : Paper Deal Entry
- Trading : Vessel Deal Entry
- Trading : Contract Fees
- Trading : Contract Specification
- Trading : Internal and Inter-entity Deal Entry
- Trading : MTM Groups
- Trading : Approvals
- Trading : Attachments
- Operations : Transaction Update
- Operations : Matching Buy/Sell Deal (Box Version)
- Operations : Matching Buy/Sell Deal (Table Version)
- Operations : Fees
- Operations : Specification Adjustment
- Operations : Inventory
- Operations : Letter of Credit
- Accounting : Fees
- Accounting : Settlement and Invoicing
- Risk Management : Strategies
- Risk Management : Valuations
- Risk Management : RM Dashboard Profit and Loss
- Risk Management : RM Dashboard Price Exposure
- Credit : Credit Exposure
- Credit : Companies
- Price Data : Prices
- Price Data : Price Series
- Price Data : Forward Curves
- Price Data : Exchange Rates
- Price Data : Formulae
- Price Data : Setup
- Reference Data : Accounting
- Reference Data : Books
- Reference Data : Calendars
- Reference Data : Commodities
- Reference Data : Container
- Reference Data : Credit
- Reference Data : Currencies
- Reference Data : Event
- Reference Data : Fee Type
- Reference Data : GT and C
- Reference Data : Incoterms
- Reference Data : Location
- Reference Data : Shipping
- Reference Data : Specification
- Reference Data : Tax
- Reference Data : Units