RM Dashboard Profit and Loss
To view Profit and Loss, go to Risk Managment and then to the RM Dashboard-> Profit and Loss tab.
In CoreTRM, you are able to monitor your profit and loss. There are a few standard report in the system that you can use. The standard reports are: YTD by Strategy, MTD by Strategy, Change by Strategy, Strategy-To-Date and Change Log.
On the left panel of the reports will show the Book Hierchary. Selecting the Book on the left will display only the profit for that book.
YTD by Strategy
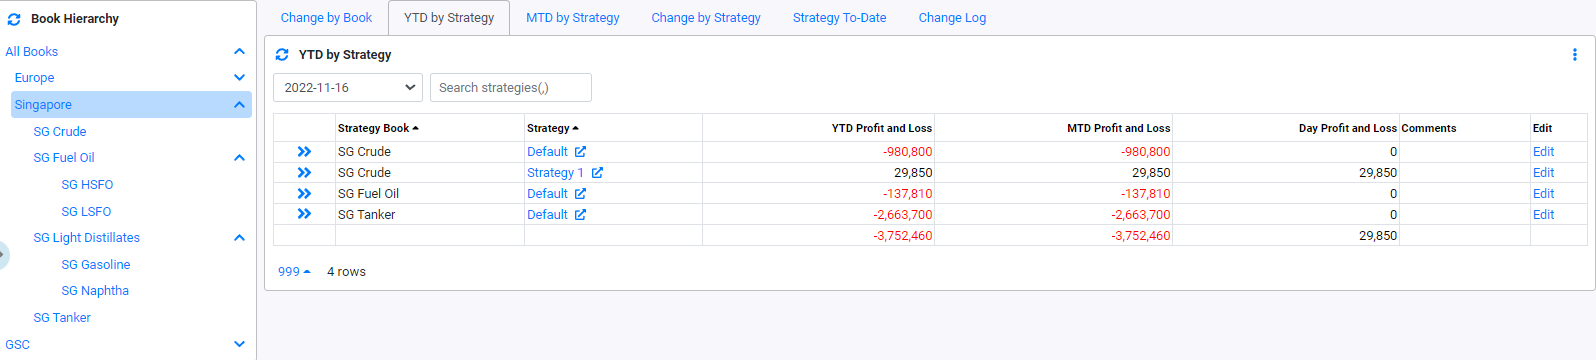
The YTD by Strategy will display the Year to Date, Month To Date and Daily Profit and Loss. The Date is relative to the valuation date of the system.
- Strategy Book, indicate the Book.
- Strategy, indicate the Strategy.
- YTD Profit and Loss, indicate the year-to-date Profit and Loss.
- MTD Profit and Loss, indicate the month-to-date Profit and Loss. It is displaying profit and loss from the 1st day of the month (relative to valuation date) till today.
- Day Profit and Loss, indicate the year-to-date Profit and Loss. By selecting today's date from the date filter will display the intra-day pnl of the date.
- Comments, display the comments added to this row. The comments are kept by day.
- Edit, clicking on "Edit" button will allow you to enter comments.
MTD by Strategy
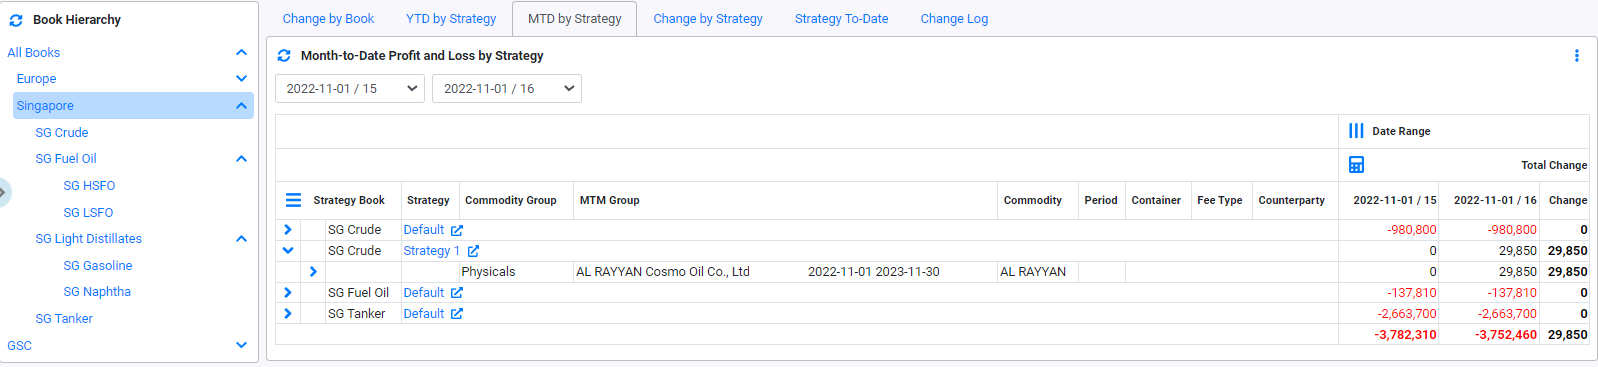
The MTD by Strategy will allow you to compare the Profit and Loss from 1st day of the Month to the selected date. The Month is relative to the valuation date of the system. Select the dates from the date filter before viewing the profit and loss. Only the last 3 days from the valuation dates are available for selection.
- Strategy Book, indicate the Book.
- Strategy, indicate the Strategy.
- Commodity Group, indicate the Commodity group. This can be view by clicking on
 .
. - MTM Group, indicate the MTM group. This can be view by clicking on .
- Commodity, indicate the Commodity. This can be view by clicking on .
- Period, indicate the Period. This is normally shown for Futures deal. This can be view by clicking on .
- Container, indicate the Container. This can be view by clicking on .
- Fee Type, indicate the Fee Type. This can be view by clicking on .
- Counterparty, indicate the Counterparty. This can be view by clicking on .
- Date from to Date To, this display the Profit and loss from first day of the month to the selected date.
- Total Change, this display the change in profit and loss between the 2 selected dates.
Change by Strategy
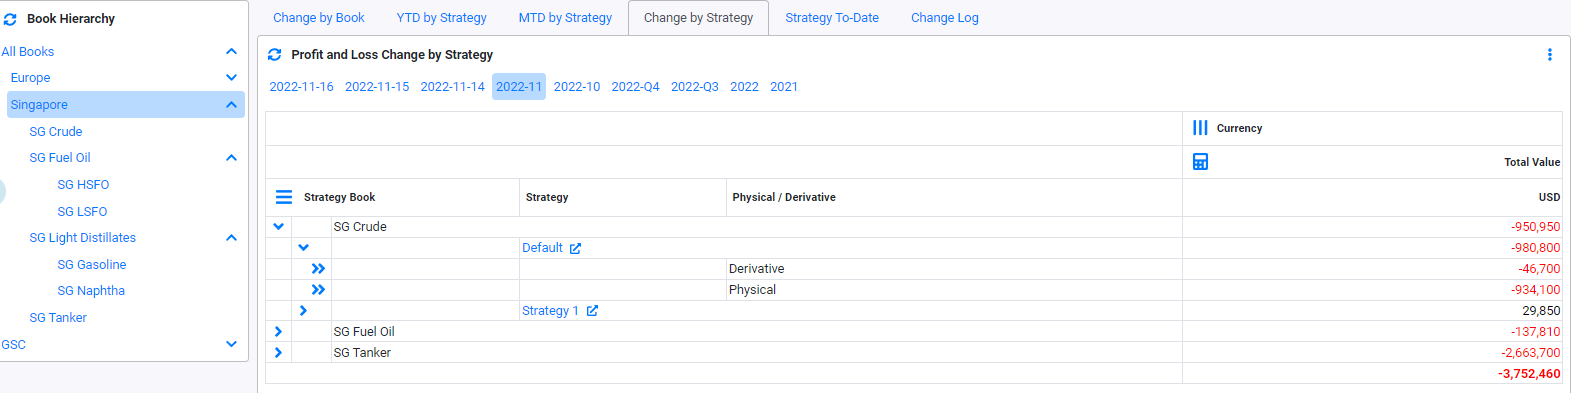
The Change by Strategy will allow you to see the total value change by date by strategy. Select the dates from the filter before viewing the profit and loss. The filter can be by day, month, quarter or year.
- Strategy Book, indicate the Book.
- Strategy, indicate the Strategy. This can be view by clicking on

- Physical/Derivatives, indicate the type of deal. This can be view by clicking on .
- Total Value, indicate the total value of the Strategy or its grouping. This can be view by clicking on .
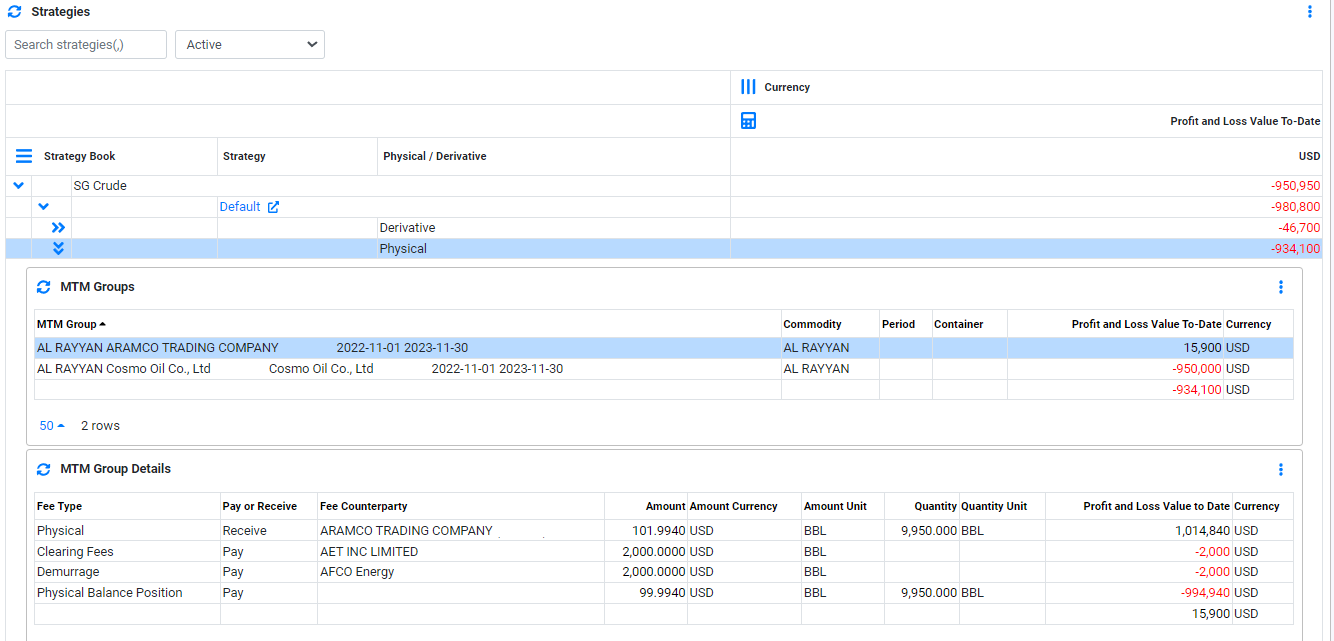
Strategy To Date
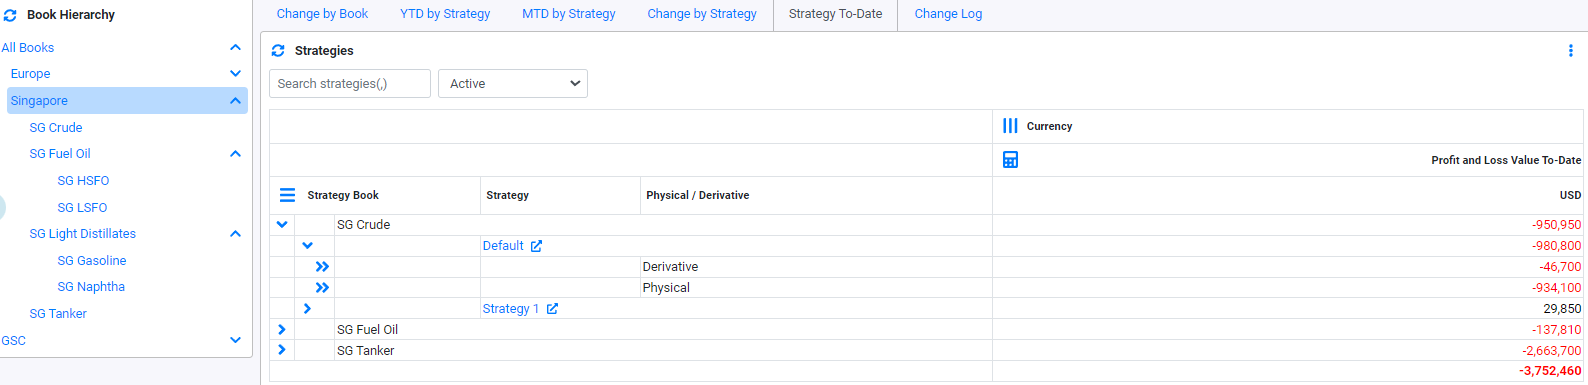
The Strategy To Date will allow you to see the profit and loss of a Strategy or deal to date (Life P&L of the deal).
- Strategy Book, indicate the Book.
- Strategy, indicate the Strategy. This can be view by clicking on
- Physical/Derivatives, indicate the type of deal. This can be view by clicking on .
- Profit and Loss Value-To_Date, indicate the Profit and Loss value to date of the Strategy or its grouping. This can be view by clicking on .
- To view the profit and loss of the deals inside the Strategy, click on .
Change Log
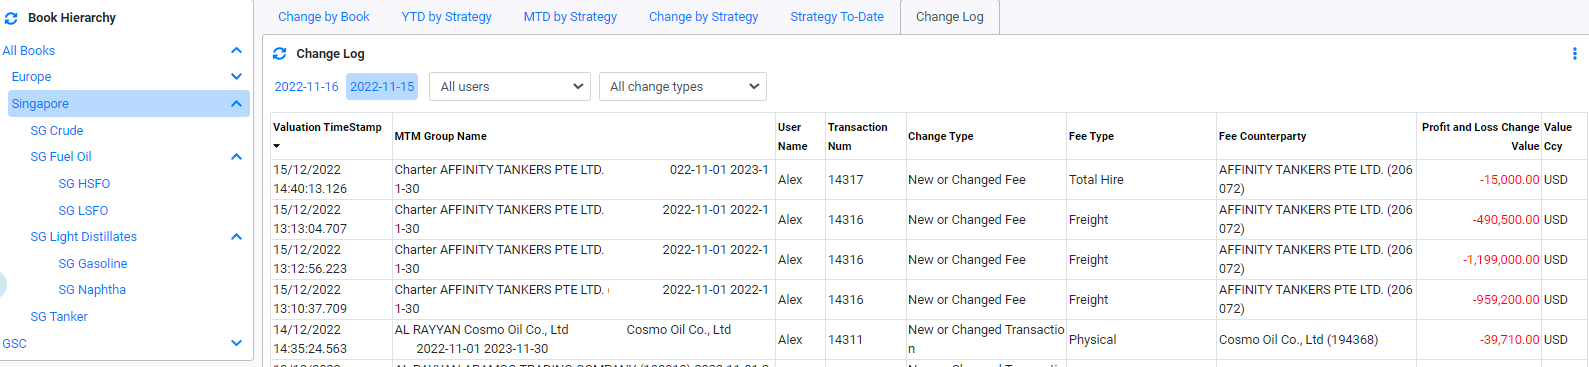
The Change Log will allow you to see the reason for profit and loss change value for a MTM Group. Select the date or filter by user and change type to view the Profit and Loss Change Value.
- Valuation TimeStamp, indicate valuation datetime that the changes was made.
- MTM Group Name, indicate the MTM Group Name that the changes was made.
- User Name, indicate the user that made the changes.
- Transaction Num, indicate the Transaction Num of the deal that the change was made.
- Change Type, indicate the Change Type that the change was caused.
- Fee Type, indicate the Fee Type of the deal that the change was made.
- Fee Counterparty, indicate the Counterparty of the deal that the change was made..
- Profit and Loss Change Value, indicate change value.
- Value Currency, indicate the change value currency.
"New or Change Fee": Indicate that a new fee is created or an existing fee has changed in value.
"New or Change Transaction": Indicate that a new transaction is created or an existing transaction has changed in value. The change can be attributed by change in quantity or price.
"Changed Price": Indicate that the price of a price series was changed. The price change in the actual price series price.
"Rebooking": Indicate that a rebooking has happened.
Browse More
- Overview
- Introduction and Navigation
- Quick Links
- Trading : Physical Deal Entry
- Trading : Paper Deal Entry
- Trading : Vessel Deal Entry
- Trading : Contract Fees
- Trading : Contract Specification
- Trading : Internal and Inter-entity Deal Entry
- Trading : MTM Groups
- Trading : Approvals
- Trading : Attachments
- Operations : Transaction Update
- Operations : Matching Buy/Sell Deal (Box Version)
- Operations : Matching Buy/Sell Deal (Table Version)
- Operations : Fees
- Operations : Specification Adjustment
- Operations : Inventory
- Operations : Letter of Credit
- Accounting : Fees
- Accounting : Settlement and Invoicing
- Risk Management : Strategies
- Risk Management : Valuations
- Risk Management : RM Dashboard Profit and Loss
- Risk Management : RM Dashboard Price Exposure
- Credit : Credit Exposure
- Credit : Companies
- Price Data : Prices
- Price Data : Price Series
- Price Data : Forward Curves
- Price Data : Exchange Rates
- Price Data : Formulae
- Price Data : Setup
- Reference Data : Accounting
- Reference Data : Books
- Reference Data : Calendars
- Reference Data : Commodities
- Reference Data : Container
- Reference Data : Credit
- Reference Data : Currencies
- Reference Data : Event
- Reference Data : Fee Type
- Reference Data : GT and C
- Reference Data : Incoterms
- Reference Data : Location
- Reference Data : Shipping
- Reference Data : Specification
- Reference Data : Tax
- Reference Data : Units